COVID-19 NYC vs Santa Clara County
Updated April 29th to include updated data and charts and notes on re-opening economies.
All data is provided by the NYC mayors office and NYC Health (https://www1.nyc.gov/site/doh/covid/covid-19-data.page)
and the SCC Public Health Dashboard (https://www.sccgov.org/sites/phd/DiseaseInformation/novel-coronavirus/Pages/dashboard.aspx).
This article is meant solely as a comparison between two populated areas of the US. Both have very different densities and mass transportation usage.
SCC was the first region in the nation to require workers to stay home. Many companies executed that on their own, before the county, as early as March 6th. The Bay Area had shelter in place on March 16th and all of CA a few days later.
NYC sheltered in place on March 20th. My some measurements 14 days later. And that may have made a difference in case growth and fatalities. Arguably Santa Clara, when they had the same number of known cases as NYC, was the first in the country to lock things down first voluntarily by major employers and then by edict.
New York is about 1–2 weeks behind the actions taken in Silicon Valley. And it is possible that seemingly small difference of days resulted in a difference in case growth. However there are other contributing factors including subways and major mass transportation in NYC and of course the population density of NYC. Mass transit may spread the virus more easily. As would large multistory living with shared HVAC. The poverty rate in NYC is 2X that of SCC. And we cannot conduct a multivariate analysis here without far more data. All we can do is look at two populations within the US and note the difference in outcomes, while we ponder the “why?”
This short article cannot assess what factors have contributed to the large difference in per capita case growth. But we can use the factual comparison of outcomes to date to open thoughtful conversation and perhaps learn more about early action as well as population density.
On March 9th both areas had approximately the same number of known cases. So, we are starting from the same point (around 40 known cases and certainly many more unknown in both regions).
The charts below speak for themselves.
X axis are all from same early start date (March 4th) when SCC had 11 cases and NYC only two.


What about the fatalities in both regions? Here we see a very similar divergence even when normalized per million residents.


ACTUAL INFECTION RATES
Based on the work of Stanford University testing 3,330 SCC residents with blood tests, they find that up to 85,000 residents have been infected (compared to a few thousand positives with swab tests). That is perhaps almost 5% of residents. The statistical method isn’t perfect. However, this infection rate data aligns with similar studies in Germany, Los Angeles and Boston (using a different method). Using this new data, we can extrapolate a very high spread rate (higher in NYC than SCC) and a low fatality rate (between 0.1% and 0.5% of all infected). This is important data, and the first high quality studies using blood tests to understand antibody prevalence in the population. Read the Stanford report here:
https://www.medrxiv.org/content/10.1101/2020.04.14.20062463v1.full.pdf
We also know from NYC and SCC that 85% to 90% of fatalities occur in people with underlying conditions or old age. Over 70yo and/or with cardiovascular conditions, obesity, heavy smoking, cancer. From this we can estimate the fatality rate of healthy people under 70yo to between 0.01% and 0.05%, or as low as 1 in 10,000. If you are young and healthy, your chance of dying, based on the limited current data, is very low. Far less than the normal flu and lower than dying in a car accident. Moreover we have seen several reputable studies (Boston, US Navy, prisons and others) showing that 60% to 100% of some populations have no symptoms whatsoever. This could be due to low viral load, genetics, or perhaps viral mutation to less fatal strains. We expect viruses to become less dangerous over time as we remove dying humans from circulation, yet leave those who are asymptomatic in circulation. Thus a mutation which can spread for 8 weeks and cause no symptoms becomes perhaps 1000X more prevalent over many months than the strain that killed its host. This is exactly what happened to the Spanish Flu. It survives today as H1N1 at shows up every year as pone of the normal flu’s that we get. It not longer kills many victims because over a 16 month period in 1918/19, it mutated to strains which were less deadly that survive today. We know that COVID-19 has at least 8 identified strains now, perhaps more. Could some be less deadly than others and be propagating faster? We don’t know, but we do know thats what killed off the Spanish flu. So it's a reasonable outcome. And why we may be seeing very high numbers of asymptomatic cases recently. Since the virus may have been present as early as October in China and January in the US, it is 7 months into perhaps an 18mo cycle of petering out itself in terms of its danger to humans.
So let’s say that the worst-case fatality rate based on these studies, when we get to test everyone including those who never had any symptoms, is 0.5%. We can extrapolate the percentage of the population who must be infected based on the totals deaths in each region. This eliminates any testing bias since it takes testing out of the equation. If these differences were simply due to testing, we would see the curves overlay each other. But as you can see, that is not the case here. In fact, based on the number of fatalities, the actual cases must be far larger as a percentage of the population in NYC versus SCC. Possibly over 25% of NYC residents may have or had the virus while in SCC it is around 1%. One would double the infection rate if the fatality rate is closer to 0.25%. And overall fatality rate may be different in different regions due to many factors including poverty, density, age, health etc. Below we estimate infections rates based on these studies to the high end of the death rate of 0.5%.

SUMMARY
Given the many different looks at what is happening, NYC has diverged in a different trajectory than Silicon Valley. Or Santa Clara County is simply weeks behind NYC, which is looking less likely.
Santa Clara County seemingly had a flat curve by acting earlier and by having far lower population density. And it’s possible that 1–2 weeks made some difference.
As for the peak? SCC passed its peak cases/day near the end of March. NYC by early April. The case load is now so low that re-opening SCC with some restrictions is a viable option as of May 1. Lives and livelihoods are both important, especially for workers with little savings. And given the fatality rate for healthy individuals (around 1/10,000), it would seem prudent to re-open with caution, perhaps for healthy people first. Case volume will increase and everyone should be prepared for some increase until there is a vaccine, perhaps later in 2021.
Both curves have flattening as you can see in the log scale chart above. Also the average daily case growth is now under 1% for both regions. And that would suggest that SCC will continue have plenty of ample empty beds (COVID patients occupy <5% of all beds today) and will not see the surge the media talks about. SCC never got close to running out of ICU beds or ventilators and more are going unused daily. The sheltering was so successful that many hospitals are laying off nurses and staff because they are near empty. NYC also peaked some weeks ago and will enter the “near empty” phase in the coming weeks as well.
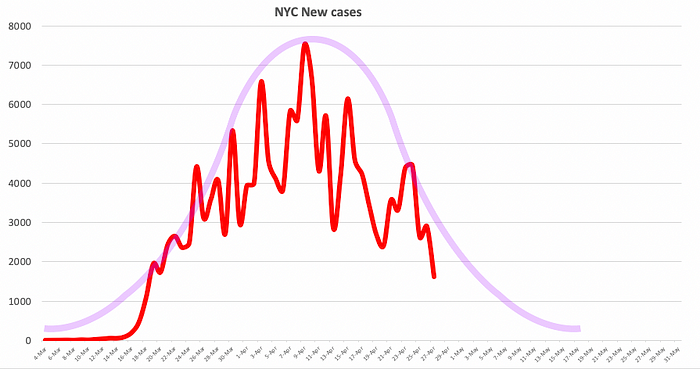


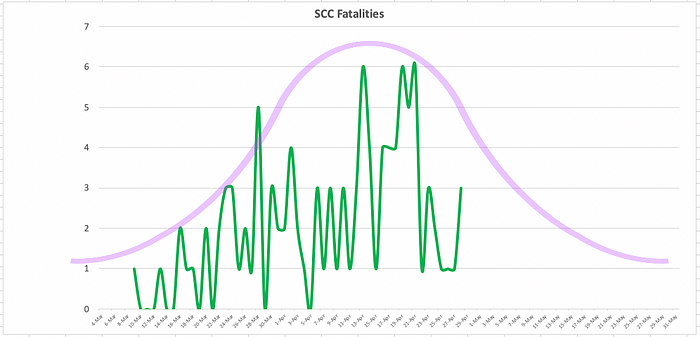


The purple curves may never actually get to zero new cases, but low numbers sub-10 in SCC and sub-100 in NYC are already achieved. As we predicted in March, the curves would show minimal new cases by May in both regions. This has turned out to be the case.
We should see people be allowed back to work sooner in the bay area than NYC. As SCC peaked in mid to late March. The new cases will never go to zero/day for weeks. But we are now seeing new cases in SCC averaging 18/day or less than 1/100,000 residents. Asymptomatic aside, that means you would have to meet 8,000 people today to statistically find one that currently has the virus, assuming 14 day active shed.
Given the large population of both (2M in Santa Clara County and 9M in NYC), there is enough population to be able to reasonably compare results. However remember the density in NYC is at least 20X higher than in Santa Clara County.
There is good news in both areas that support re-opening carefully, for select healthy populations in SCC immediately, and in NYC in mid May.
Graphs are accurate to April 27th, 2020.
